
JUMP DOWN TO:

U.S. NATIONAL WEATHER SERVICE
STORM PREDICTION CENTER
NATIONAL HURRICANE CENTER
WEATHER PREDICTION CENTER
CLIMATE PREDICTION CENTER
GREAT LAKES ENVIRONMENTAL RESEARCH LABORATORY
AVIATION WEATHER CENTER
OCEAN PREDICTION CENTER
SPACE WEATHER PREDICTION CENTER
U.S. National Weather Service
National Weather Service Watch/Warning/Advisory Map:

National Weather Service Watch/Warning/Advisory:
NATIONAL RADAR LOOP:

GLM FED & GEOCOLOR SATELLITE:

Storm Prediction Center
Current Convective Outlook With Watches And Radar Mosaic:

Today's Convective Outlook:

Today's Tornado Probabilities:

Today's Wind Probabilities:

Today's Hail Probabilities:

Tomorrow's Convective Weather Outlook:

Tomorrow's Tornado Probabilities:

Tomorrow's Wind Probabilities:

Tomorrow's Hail Probabilities:

Day 3 Convective Outlook:

Days 4-8 Convective Outlook:

Active Severe/Tornado Watches:

Active Mesoscale Discussions:

Today's Storm Reports:

Annual Tornado Watch Summary:

Annual Severe Thunderstorm Watch Summary:

Tornado Summary:


Hail Summary:

Wind Summary:

Day 1 Fire Weather Forecast:

Day 2 Fire Weather Outlook:

Days 3-8 Fire Weather Outlook:

Surface Map:

Visible Satellite:

MSLP And Surface Winds:

Surface Temperature, Dewpoint, And PMSL:

Precipitable Water:

Upwind Propagation Vector:

Surface Moisture Convergence And Mixing Ratio:

Deep Moisture Convergence:

Theta-E Advection:

2 Hour Surface Pressure Change:

850 mb Analysis:

850 mb Temperature Advection:

850 mb Moisture Advection:

700 mb Analysis:

500 mb Analysis:

300 mb Analysis:

SBCAPE/SBCIN:

SFC-3KM CAPE/Vorticity:

100 mb CAPE:

MUCAPE:

Normalized CAPE:

Downdraft CAPE:

Surface Based Lift Index:

0-1KM EHI:

0-3KM EHI:

0-3KM VGP:

LCL Heights:

LFC Heights:

LCL - LFC Mean Relative Humidity:

Low Level Lapse Rates (0-3KM):

Mid Level Lapse Rates (700-500mb):

Surface To 2KM Storm Relative Winds:

4-6KM Storm Relative Winds:

9-11KM Storm Relative Winds:

Anvil Level Storm Relative Winds:

850-300 mb Mean Wind:

850mb And 500mb Wind Crossover:

0-1KM Bulk Wind Shear:

Surface To 6KM Bulk Shear:

Effective Bulk Shear:

BRN Shear:

0-1KM Storm Relative Helecity:

0-3KM Storm Relative Helecity:

Effective Storm Relative Helecity:

Supercell Composite Parameter:

Fixed Layer Significant Tornado Parameter:

Effective Layer Significant Tornado Parameter:

Significant Hail Parameter:

Derecho Composite Parameter:

Craven/Brooks Significant Severe Weather Parameter:

MCS Maintenance Probability:

Near Freezing Surface Temperatures:

Surface Wet Bulb Temperatures:

Freezing Level:

Critical Thickness:

800-750mb EPVg:

650-500mb EPVg:

Lake Effect Snow 1:

Lake Effect Snow 2:

Fosberg Fire Weather Index:

Lower Atmospheric Severity Index:

Low Elevation Haines Index:

Mid Elevation Haines Index:

High Elevation Haines Index:

SREF 24 Hour Calibrated Thunderstorm Probability (Latest Run):

SREF 24 Hour Calibrated Severe Thunderstorm Probability (Latest Run):

SREF 24 Hour Precipitation (Latest Run):

SREF 12 Hour Snowfall (Latest Run):

National Hurricane Center
Atlantic Marine Forecast:
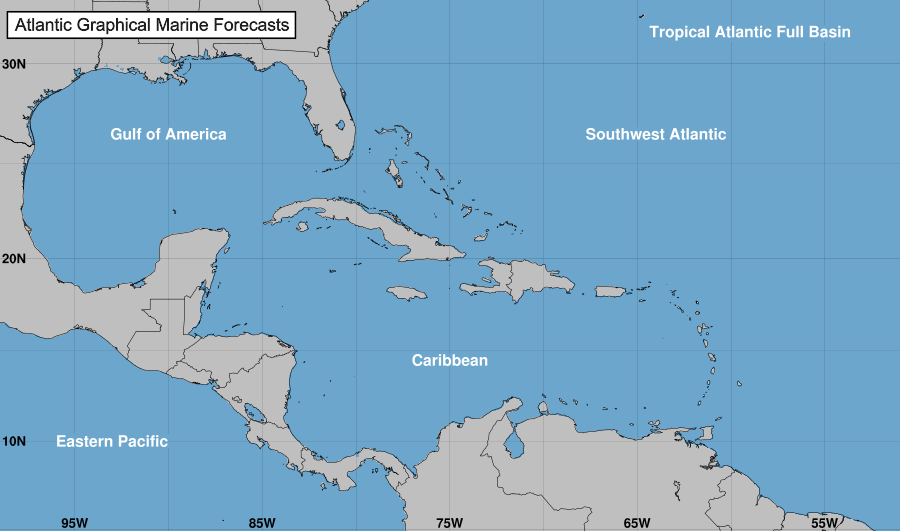

Active Atlantic Tropical Cyclones:
Atlantic 5-Day Tropical Cyclone Outlook:

Eastern Pacific Marine Forecast:
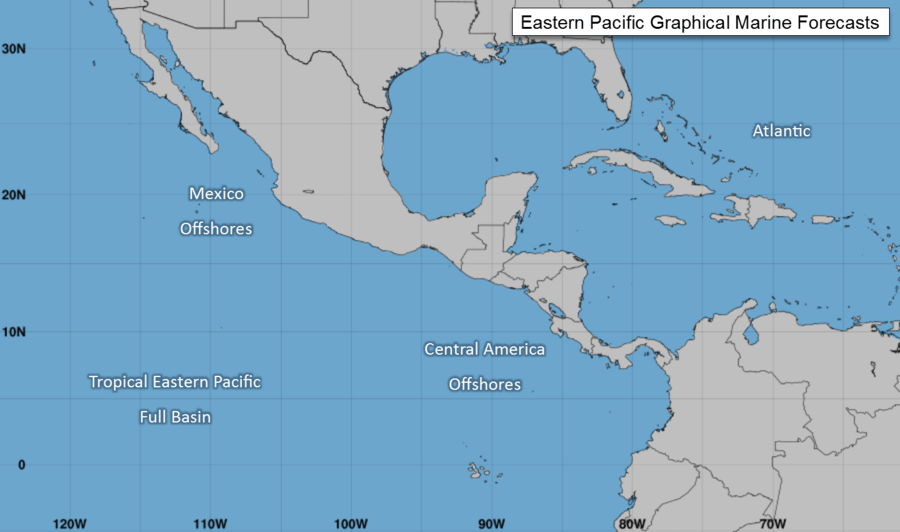

Active Eastern Pacific Tropical Cyclones:
Eastern Pacific 5-Day Tropical Cyclone Outlook:

Weather Prediction Center
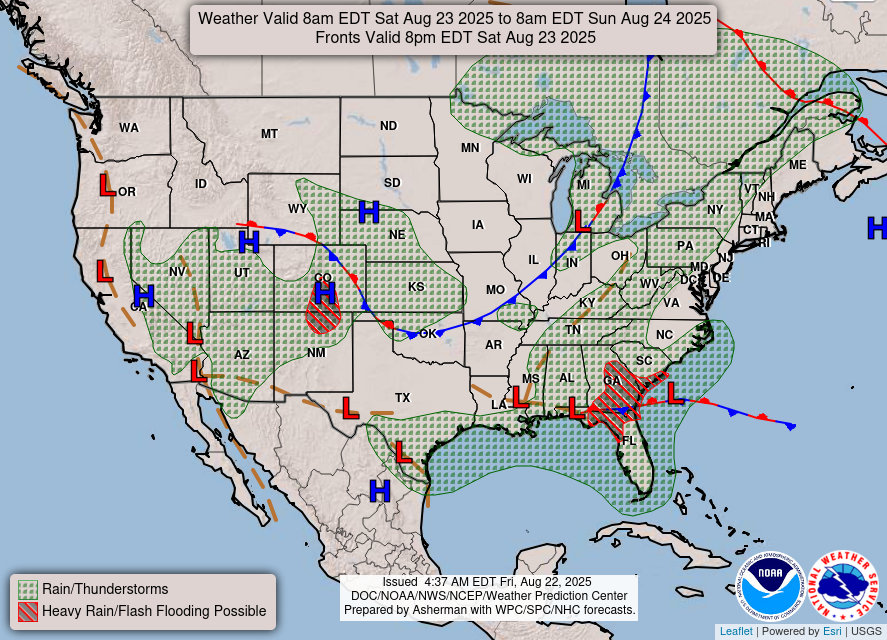
National Forecast Chart (Day 1):

National Forecast Chart (Day 2):

National Forecast Chart (Day 3):
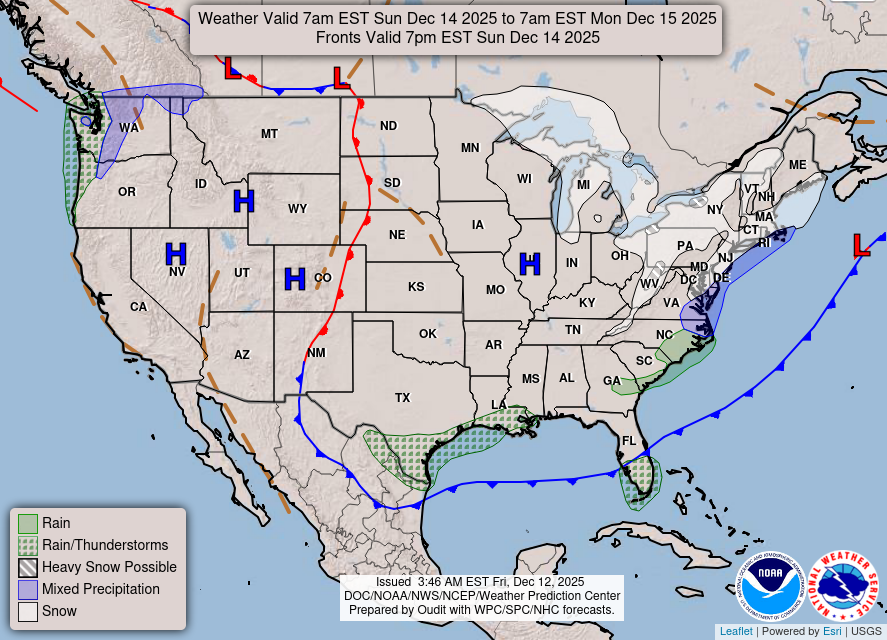

Short Range Forecasts (Days ½-2½):

Medium Range Hazards Forecast:

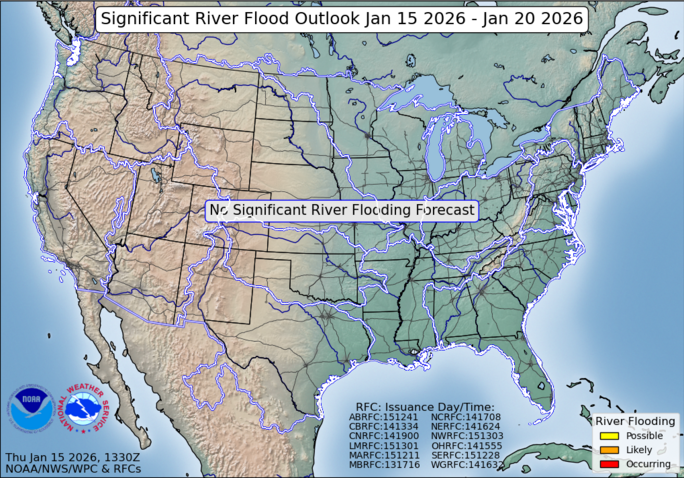
Significant Flood Outlook:

Day 1 Excessive Rainfall Outlook:

Day 2 Excessive Rainfall Outlook:

Day 3 Excessive Rainfall Outlook:

Current Mesoscale Precipitation Discussions:

Day 1 Total QPF:

Day 2 Total QPF:

Day 3 Total QPF:

Days 1-7 Total QPF:

Day 1 Snow Probability Of At Least 4 Inches:

Day 1 Snow Probability Of At Least 8 Inches:

Day 1 Snow Probability Of At Least 12 Inches:

Day 2 Snow Probability Of At Least 4 Inches:

Day 2 Snow Probability Of At Least 8 Inches:

Day 2 Snow Probability Of At Least 12 Inches:

Day 3 Snow Probability Of At Least 4 Inches:

Day 3 Snow Probability Of At Least 8 Inches:

Day 3 Snow Probability Of At Least 12 Inches:

Day 1 Probability Of Freezing Rain Reaching Or Exceeding 0.25 Inch:

Day 2 Probability Of Freezing Rain Reaching Or Exceeding 0.25 Inch:

Day 3 Probability Of Freezing Rain Reaching Or Exceeding 0.25 Inch:

Forecast Surface Low Positions (Uncertainty Circles Included):

Forecast Surface Low Positions (Ensemble Clusters Included):

Climate Prediction Center
Days 6-10 Temperature Outlook:

Days 6-10 Precipitation Outlook:

Days 8-14 Temperature Outlook:

Days 8-14 Precipitation Outlook:

Days 8-14 All Hazards Outlook:

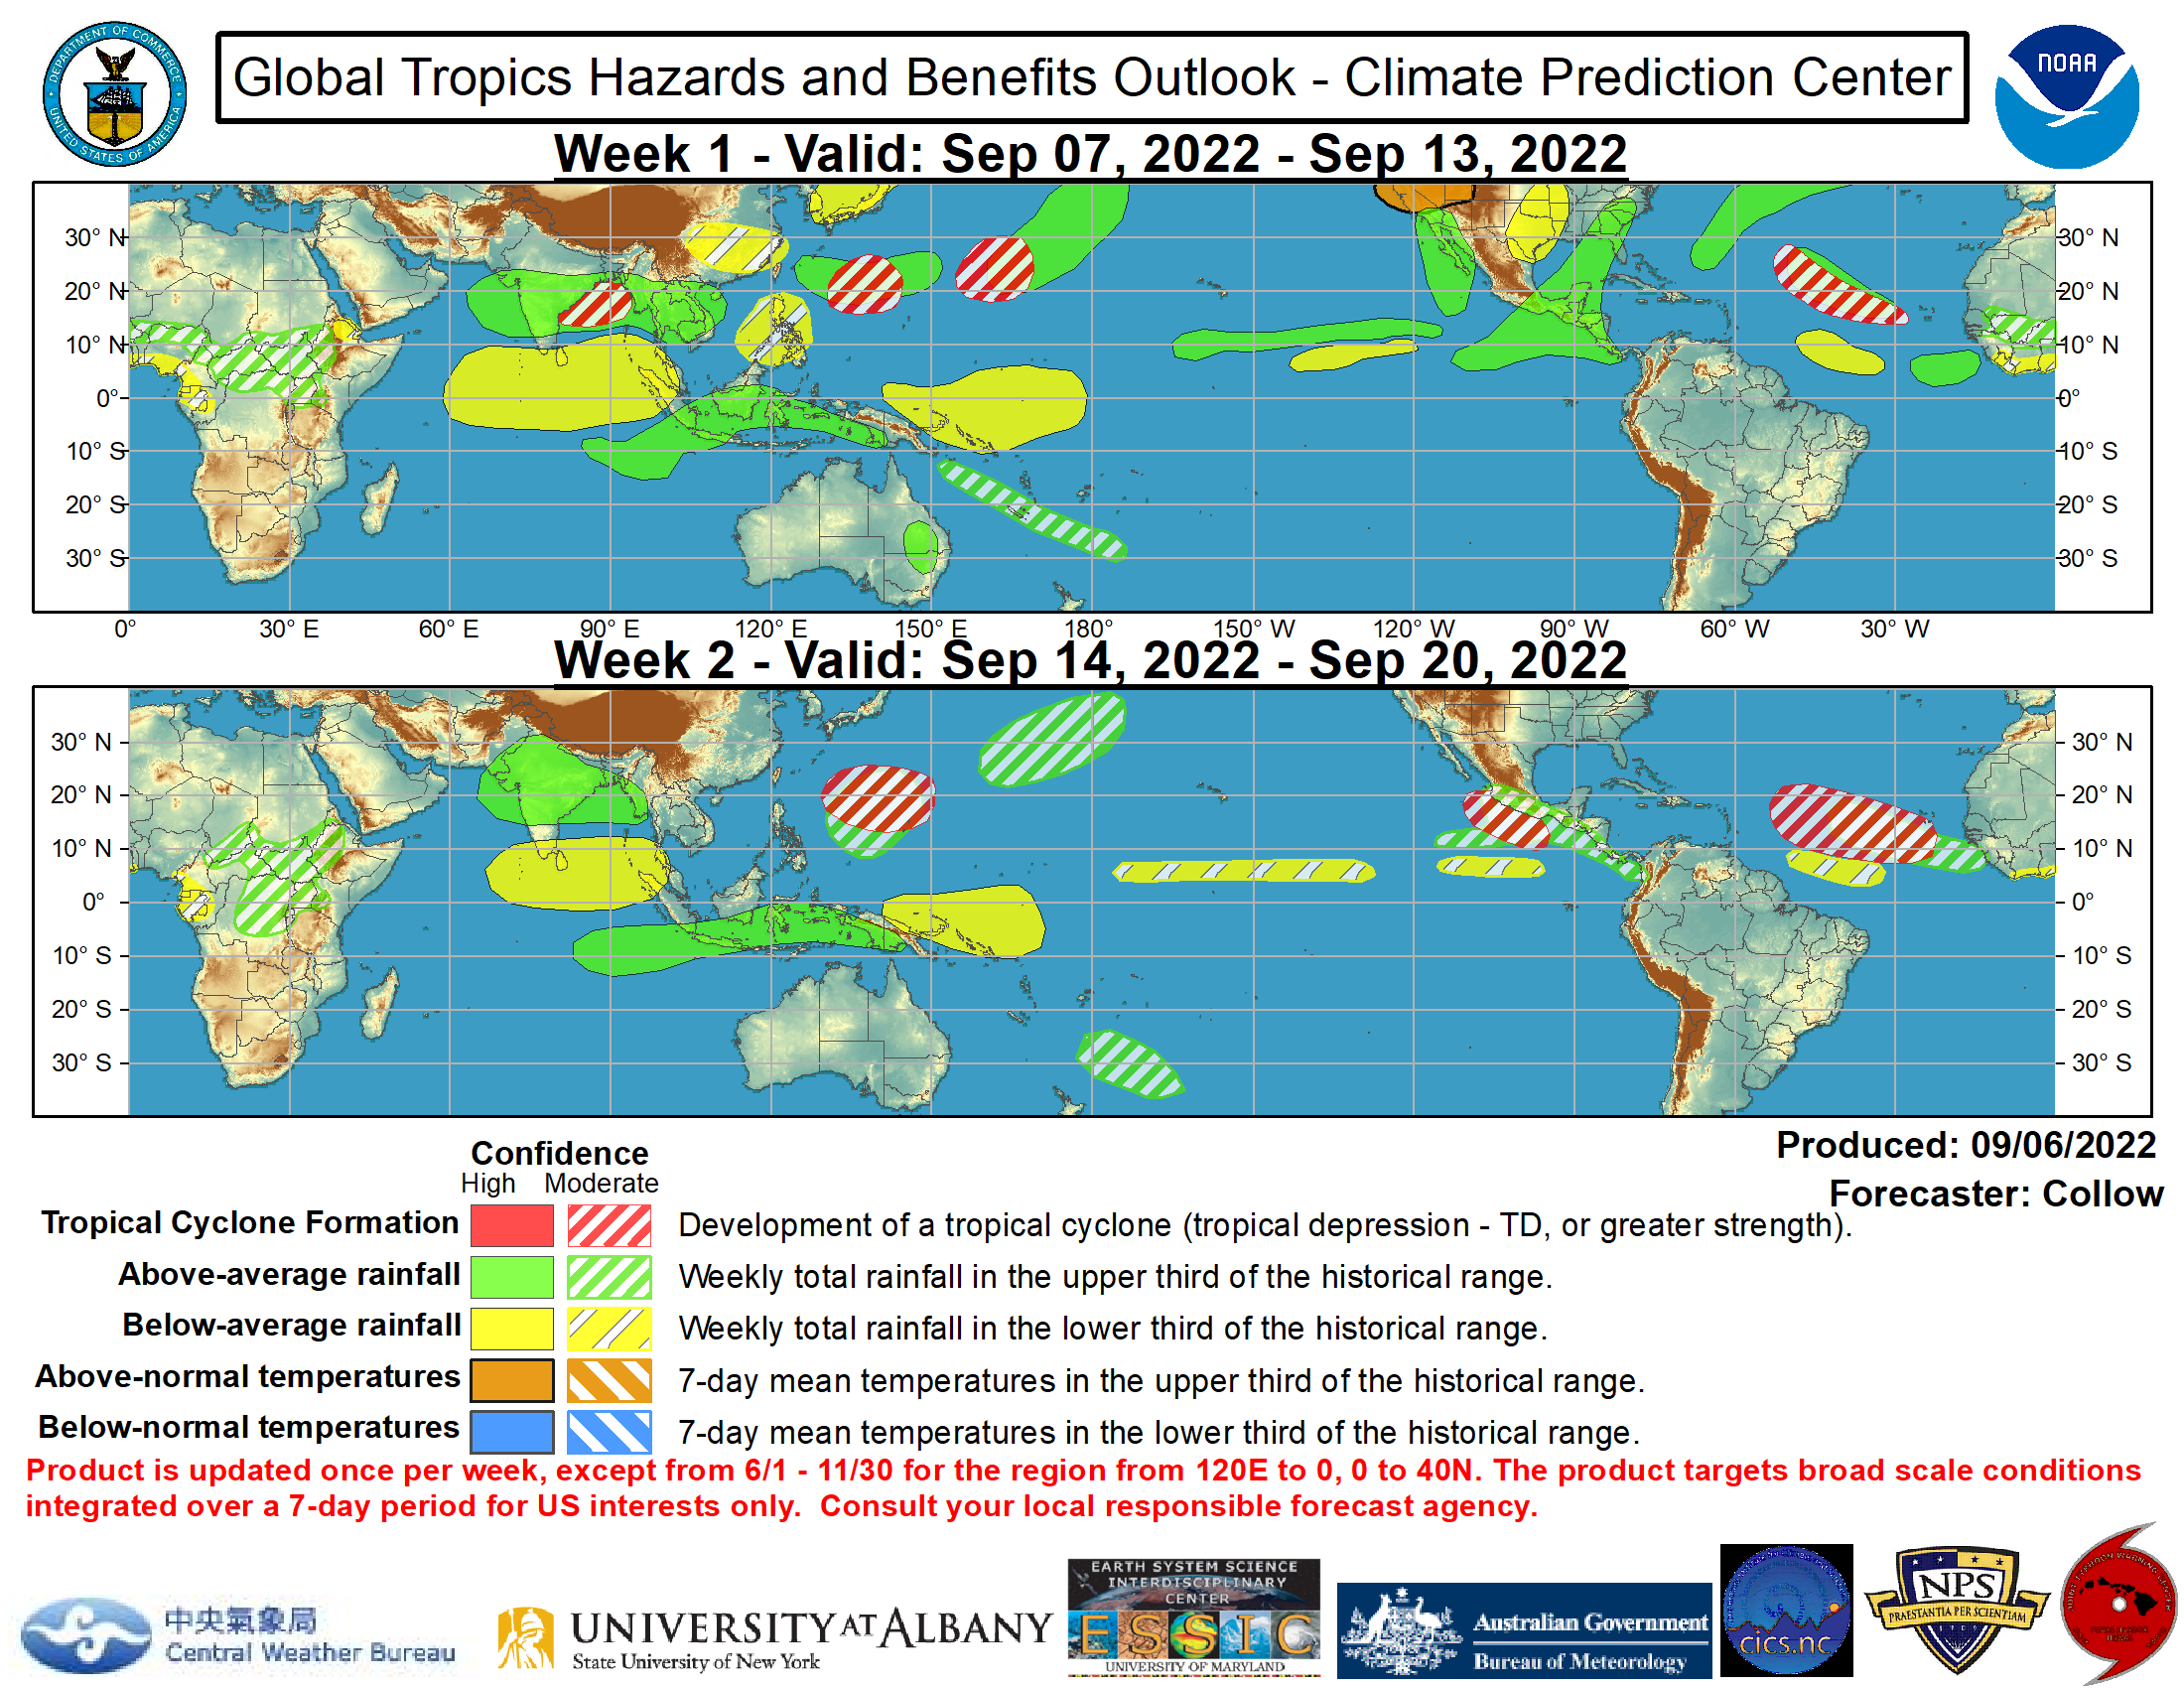
Weeks 1-2 Tropics Hazard Outlook:

Weeks 3-4 Temperature Outlook:

Weeks 3-4 Precipitation Outlook:

One Month Temperature Outlook:

One Month Precipitation Outlook:

Three Month Temperature Outlook:

Three Month Precipitation Outlook:

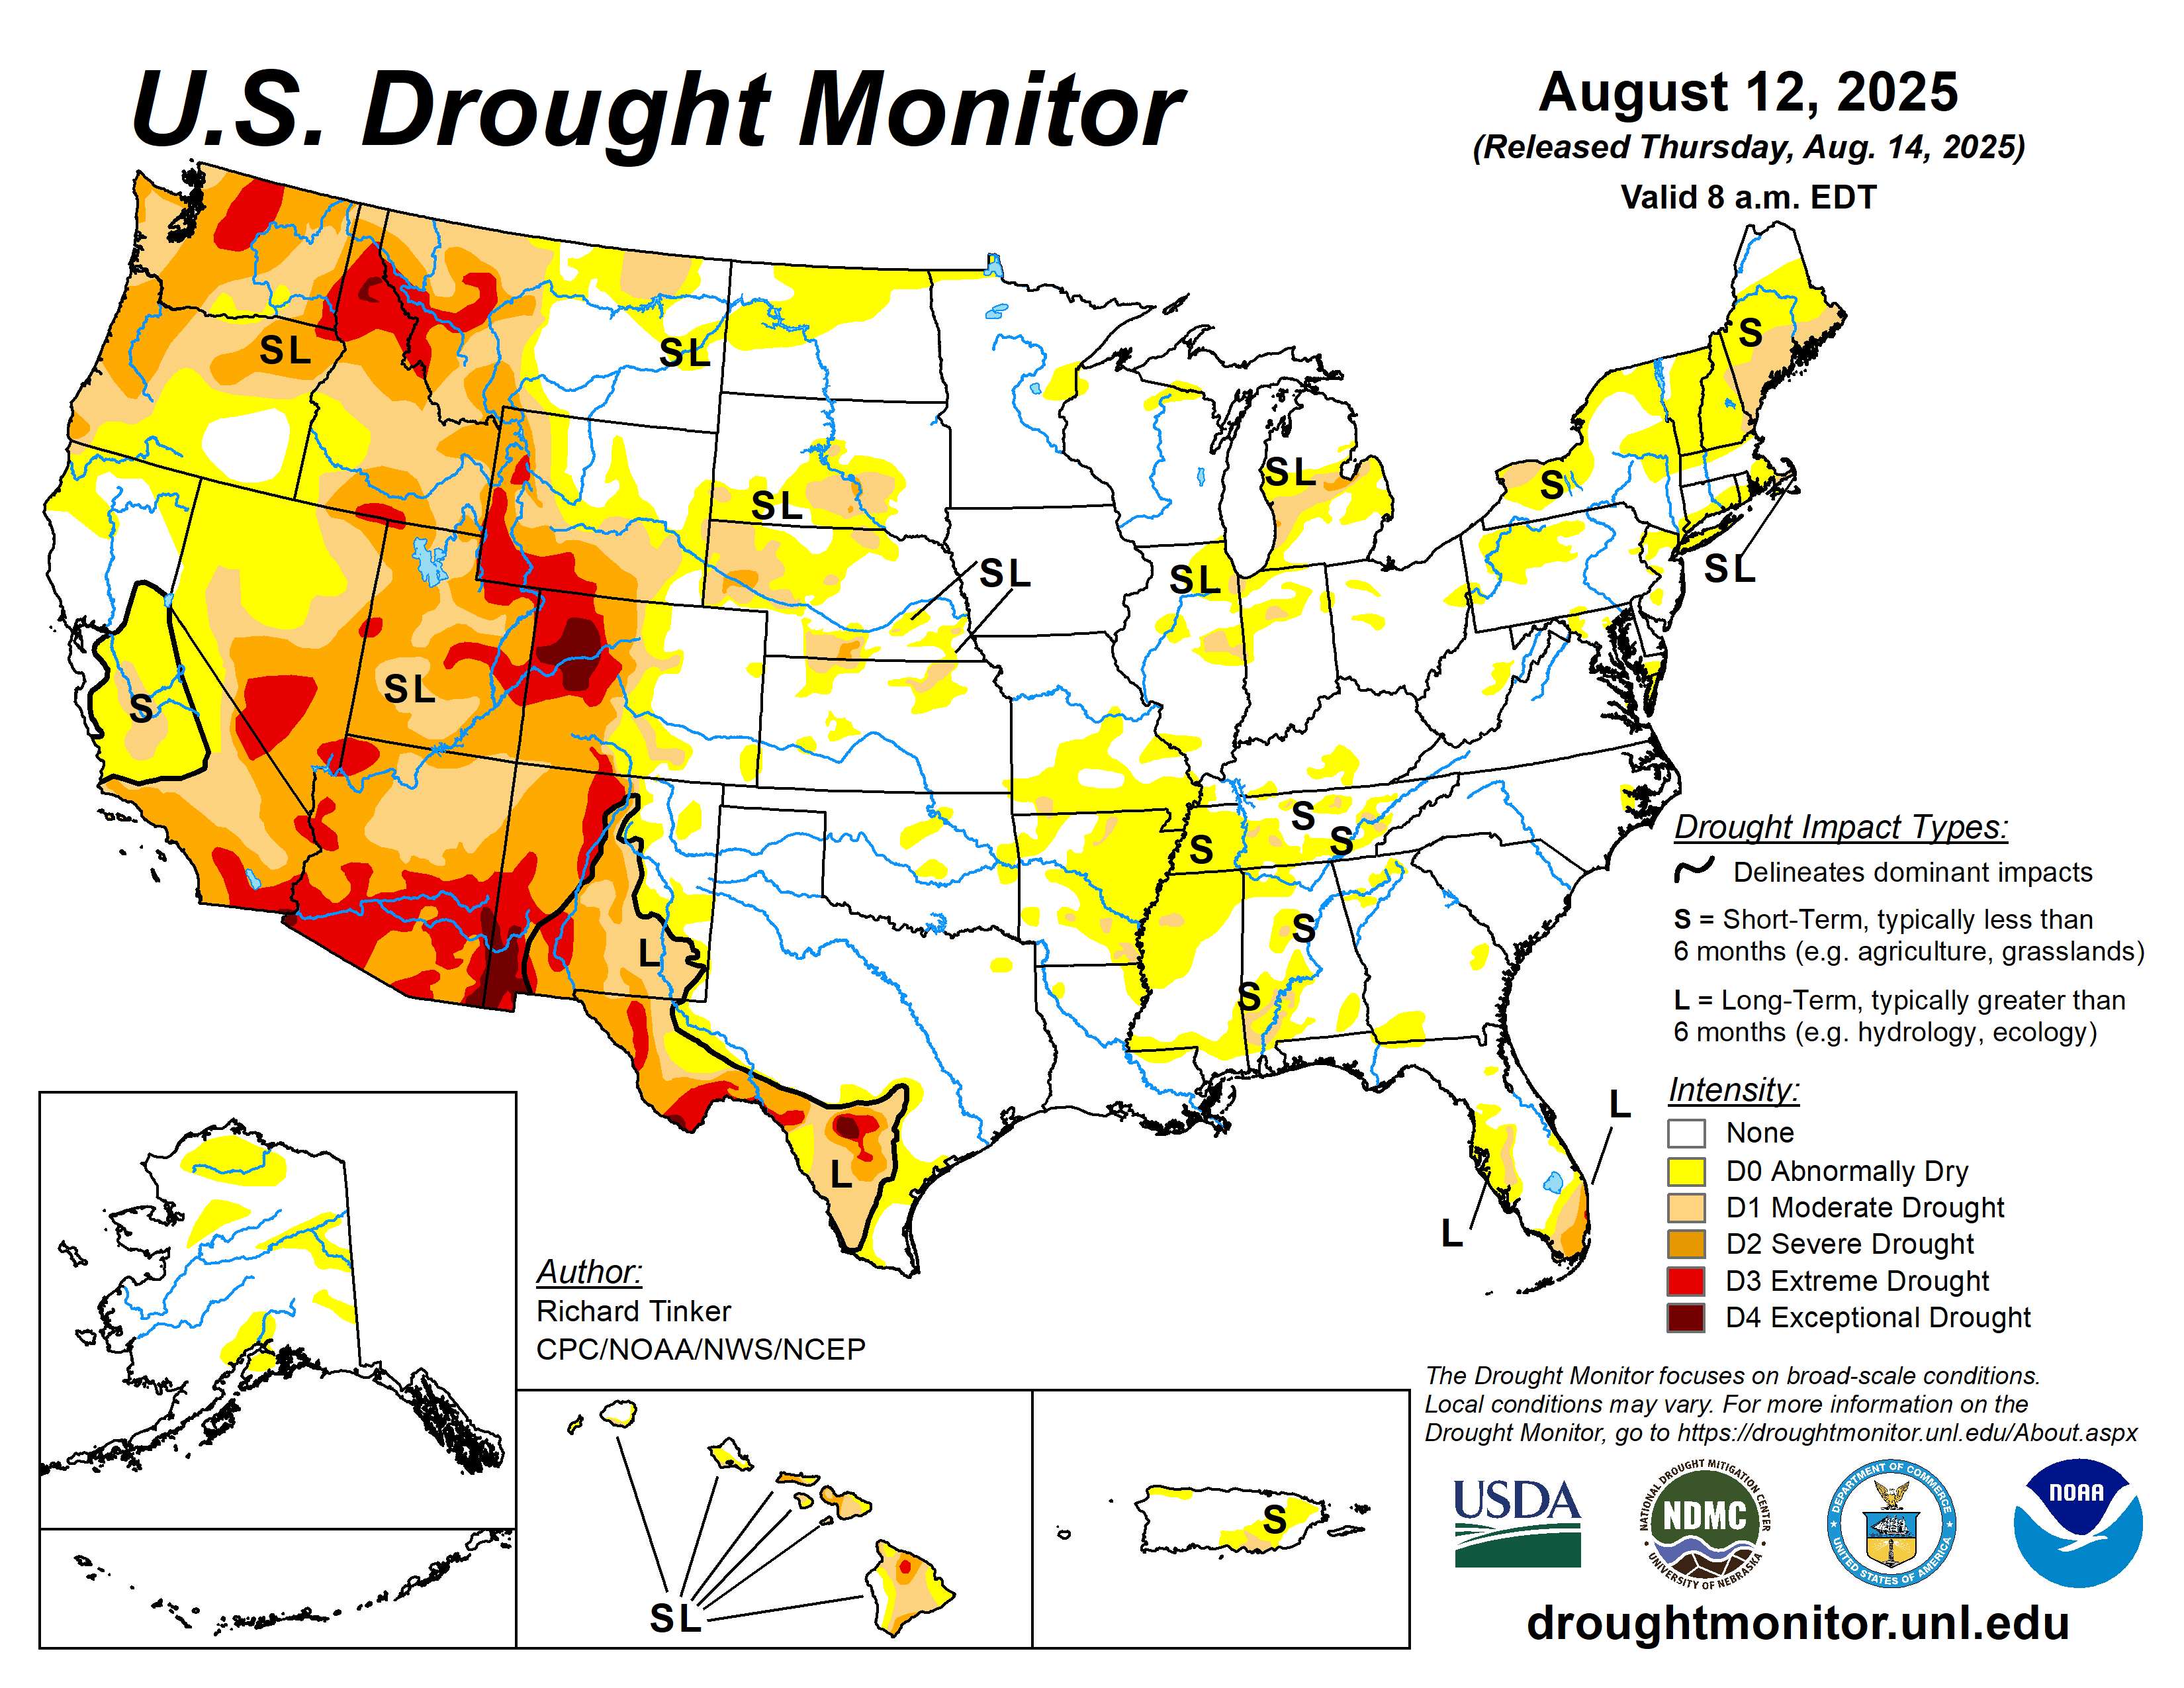
U.S. Drought Monitor:

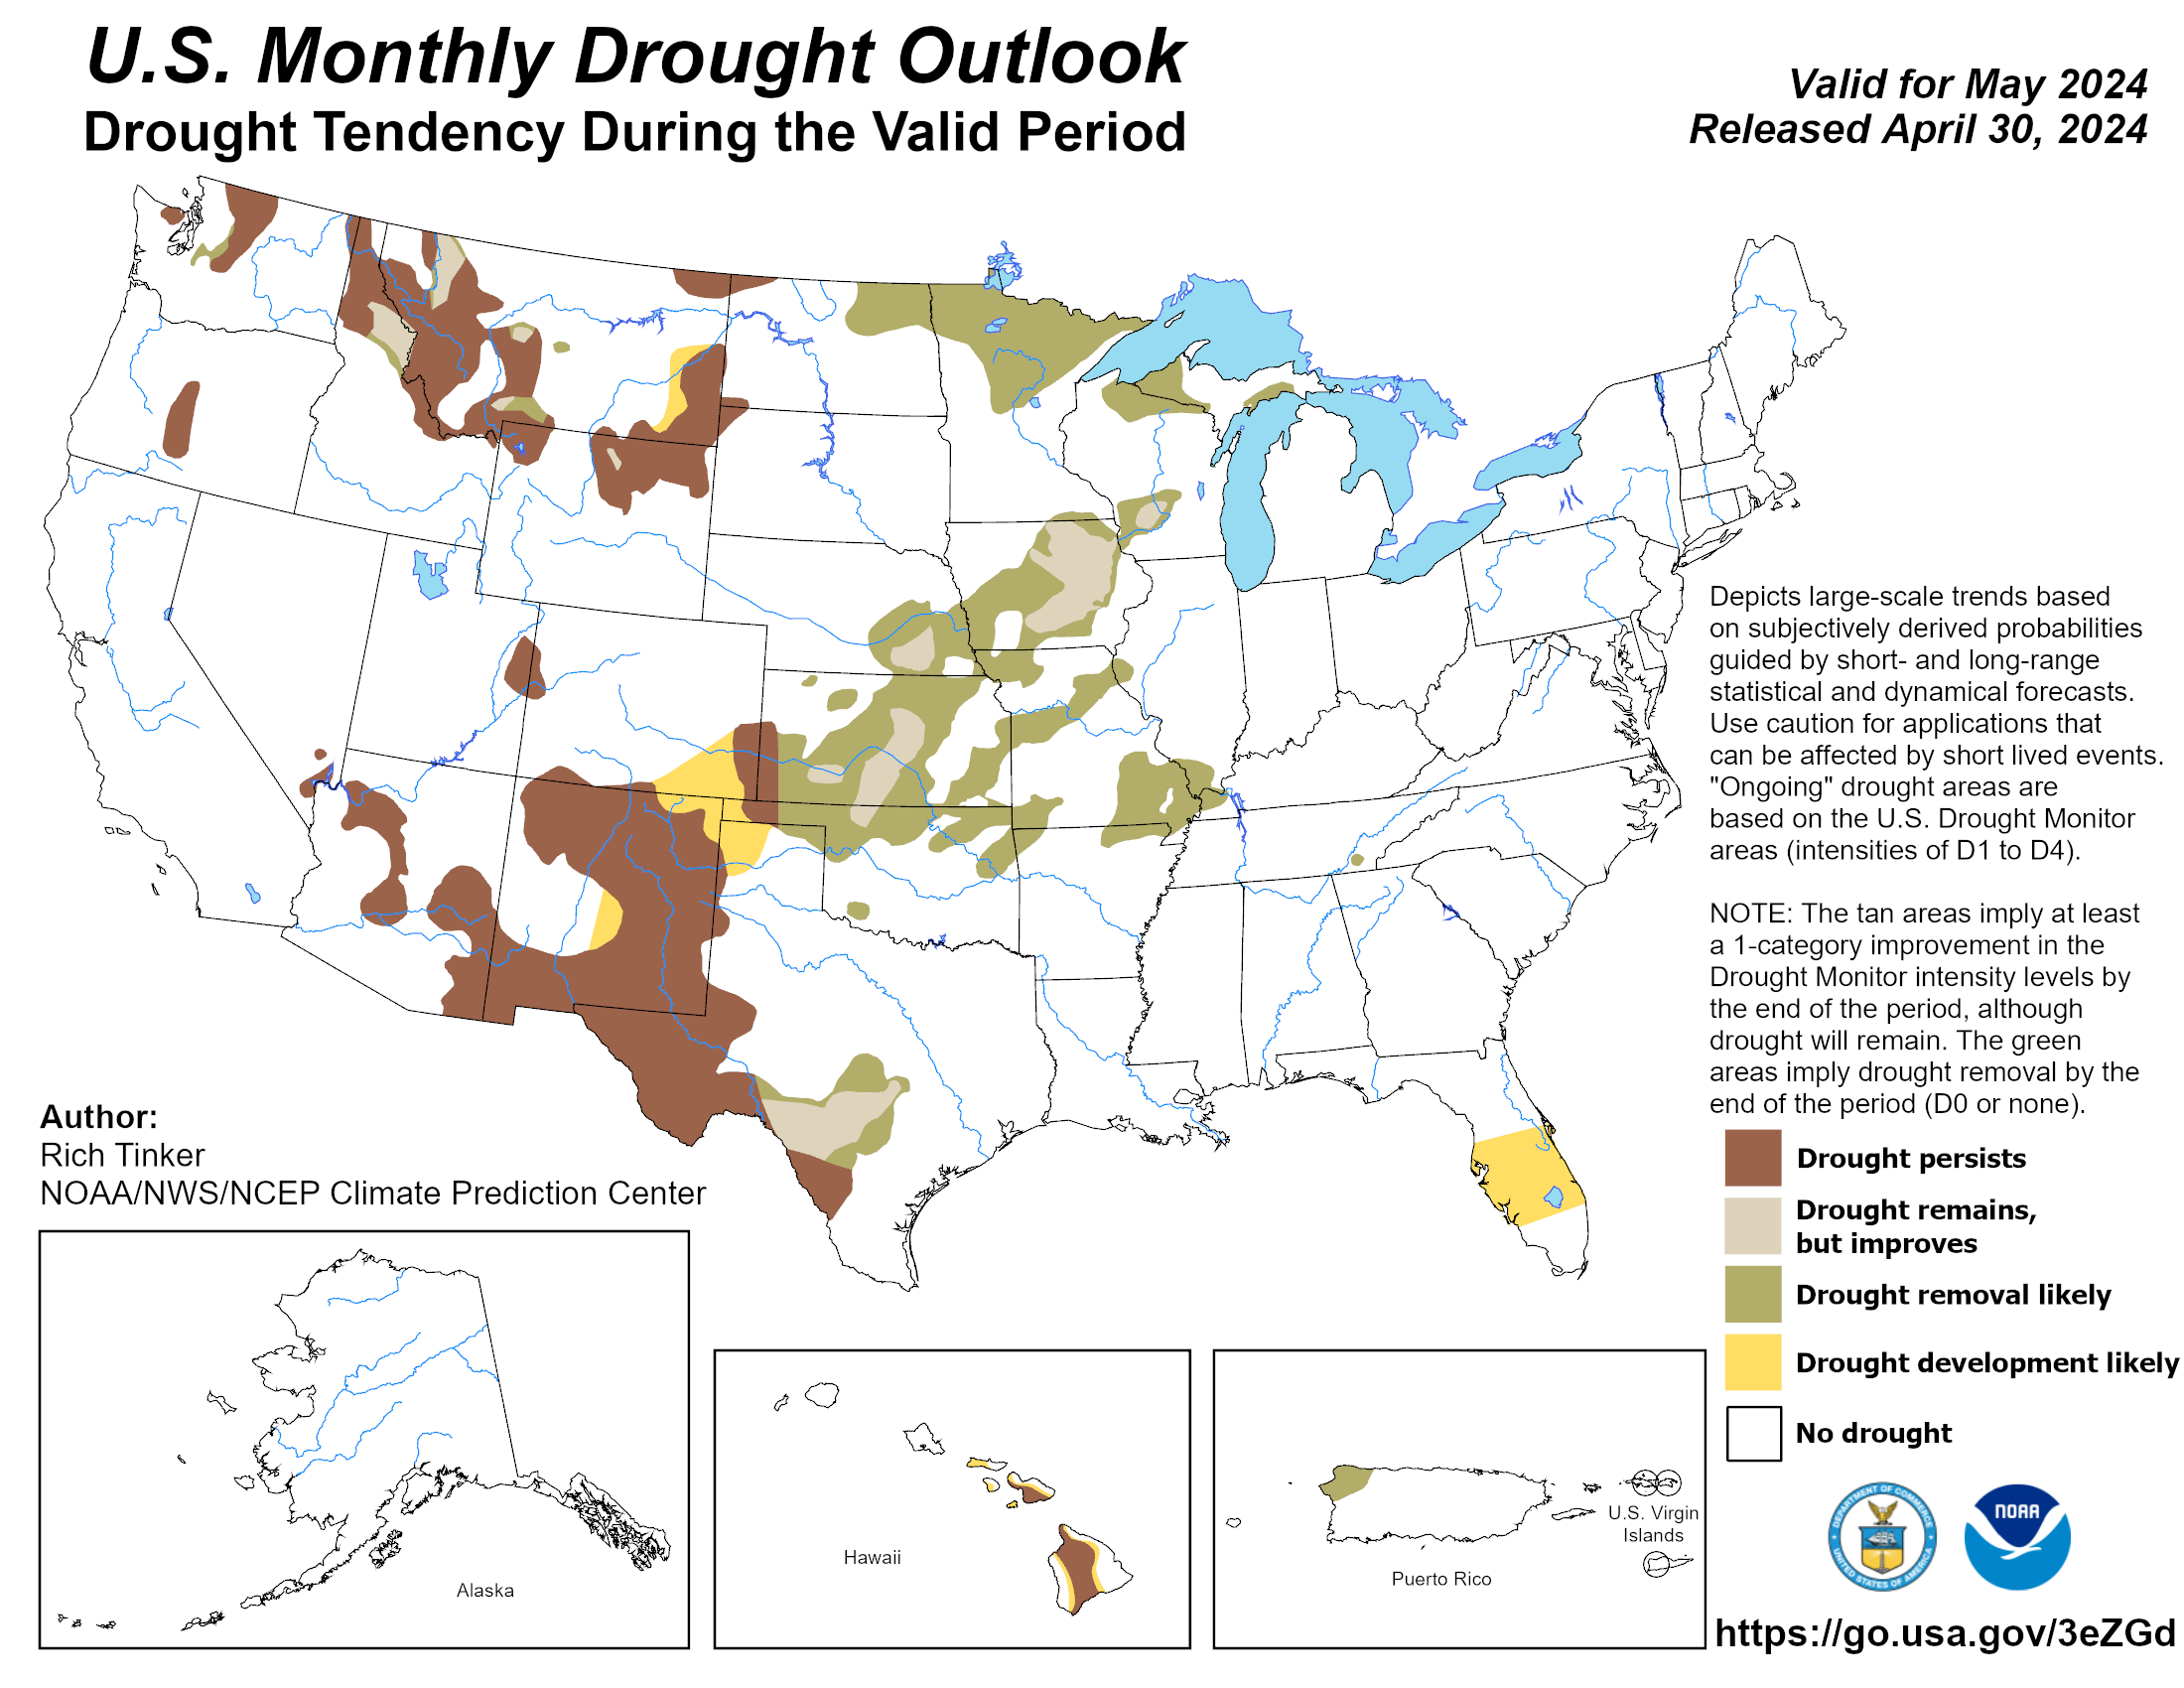
U.S. Drought Monthly Outlook:

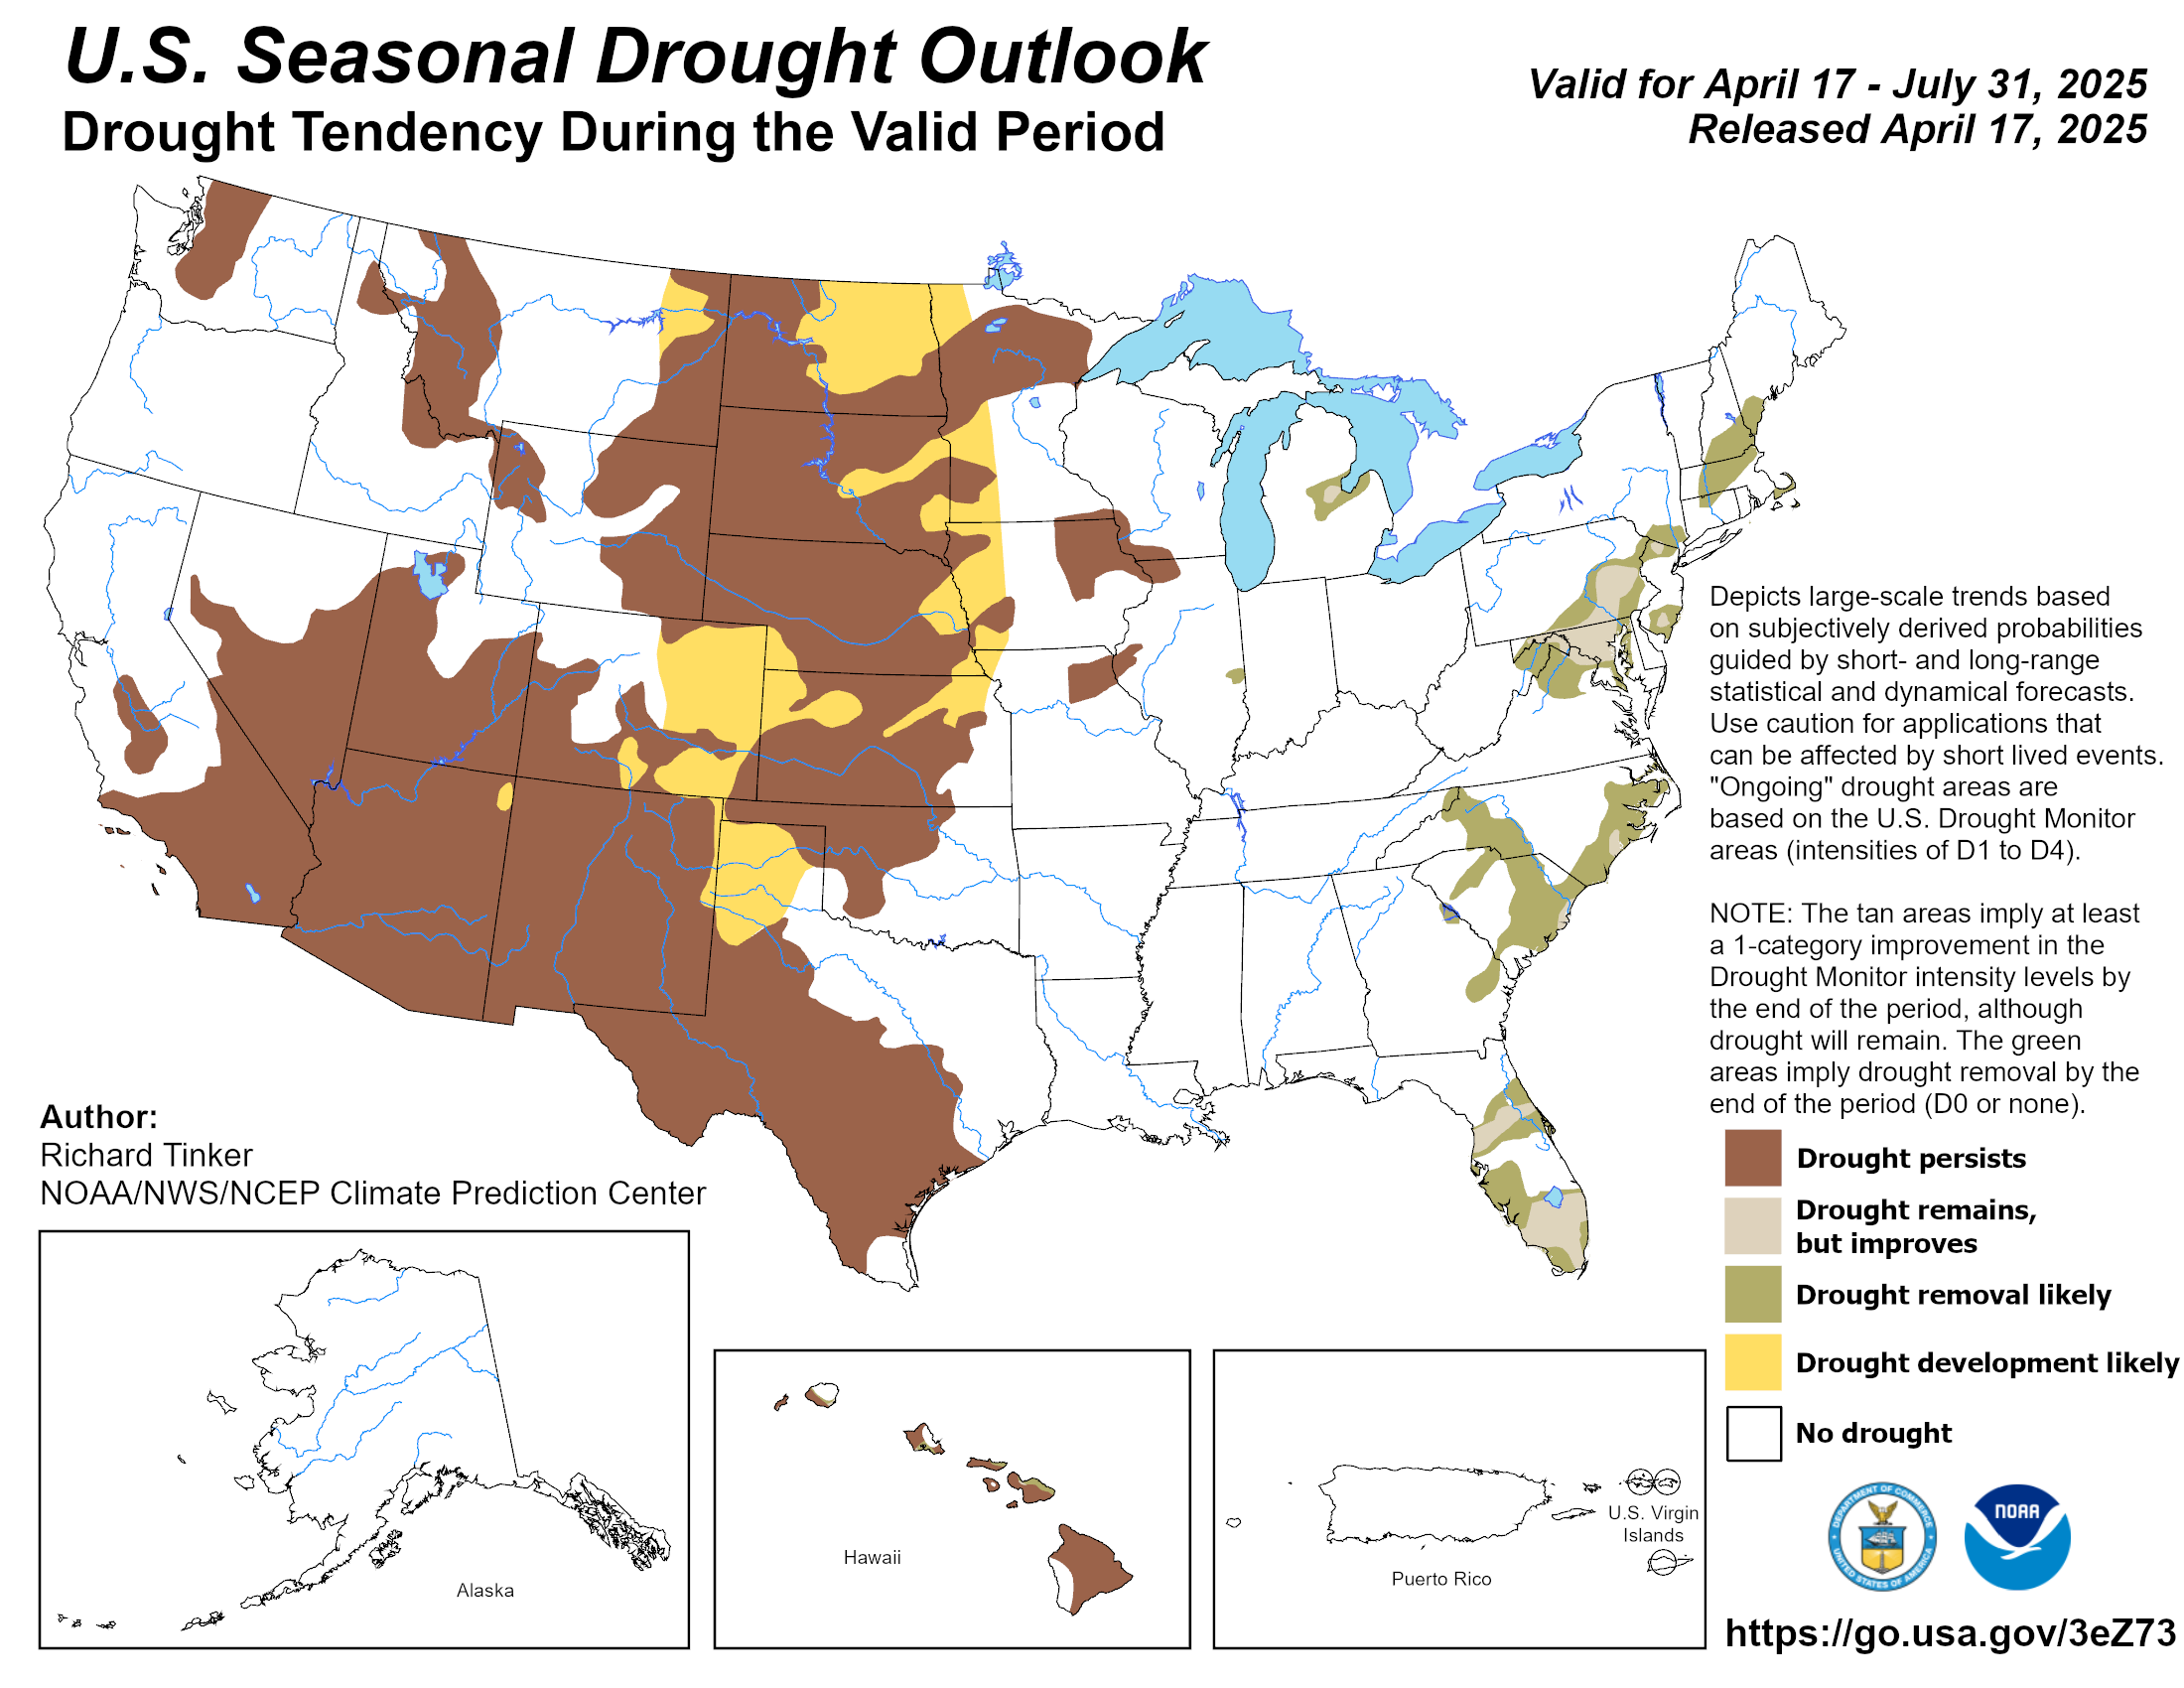
U.S. Drought Seasonal Outlook:

SEA SURFACE TEMPERATURES:

SEA SURFACE TEMPERATURE ANOMALIES:

GLOBAL SEA SURFACE TEMPERATURES/ANOMALIES:

Equatorial Temperatures:

Equatorial Temperature Anomalies:

Daily Madden-Julian Oscillation Indices
5 Day Running Mean:

Daily Madden-Julian Oscillation Indices
15 Day Running Mean:

Observed Northern Hemisphere Atmospheric Blocking:


Observed Southern Hemisphere Atmospheric Blocking:


Aviation Weather Center
PIRIP/Flight Catagory:


Ocean Prediction Center
Pacific Weather Analysis And Forecasts:

Atlantic Weather Analysis And Forecasts:

Arctic Weather Analysis And Forecasts:

Arctic Sea Ice Concentration:

Antarctic Sea Ice Concentration:

Great Lakes Environmental Research Laboratory
Great Lakes Ice Cover:

Great Lakes Air Temperatures:

Great Lakes Air Temperatures Forecast (Latest Run):

Great Lakes Water Temperatures:

Great Lakes Water Temperatures Forecast (Latest Run):

Great Lakes Cloud Cover:

Great Lakes Cloud Cover Forecast (Latest Run):

Great Lakes Winds:

Great Lakes Wind Forecast (Latest Run):

Great Lakes Waves:

Great Lakes Waves Forecast (Latest Run):

Lake Superior Hydrograph:

Lakes Michigan And Huron Hydrograph:

Lake St. Claire Hydrograph:

Lake Erie Hydrograph:

Lake Ontario Hydrograph:

Space Weather Prediction Center
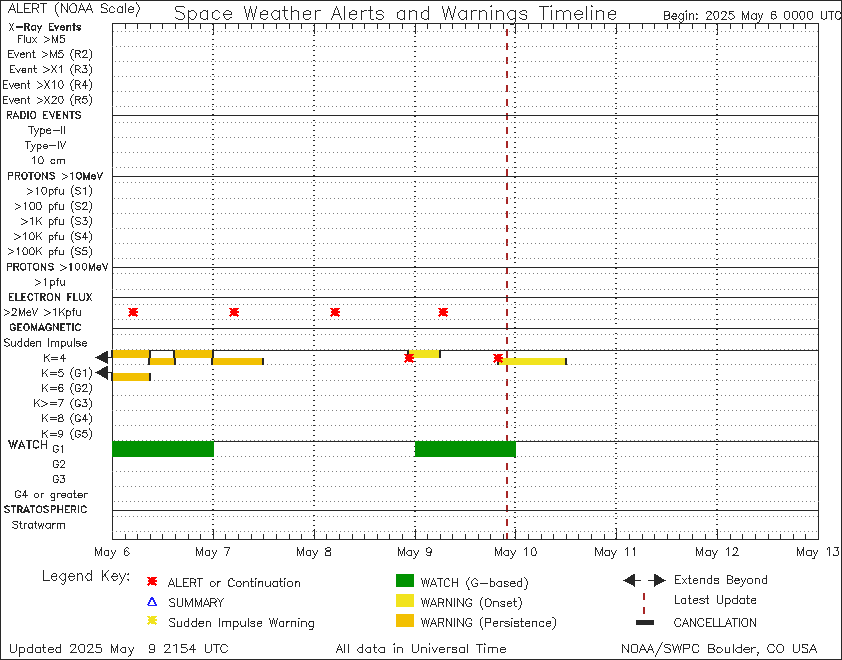
Space Weather Alerts And Warnings:

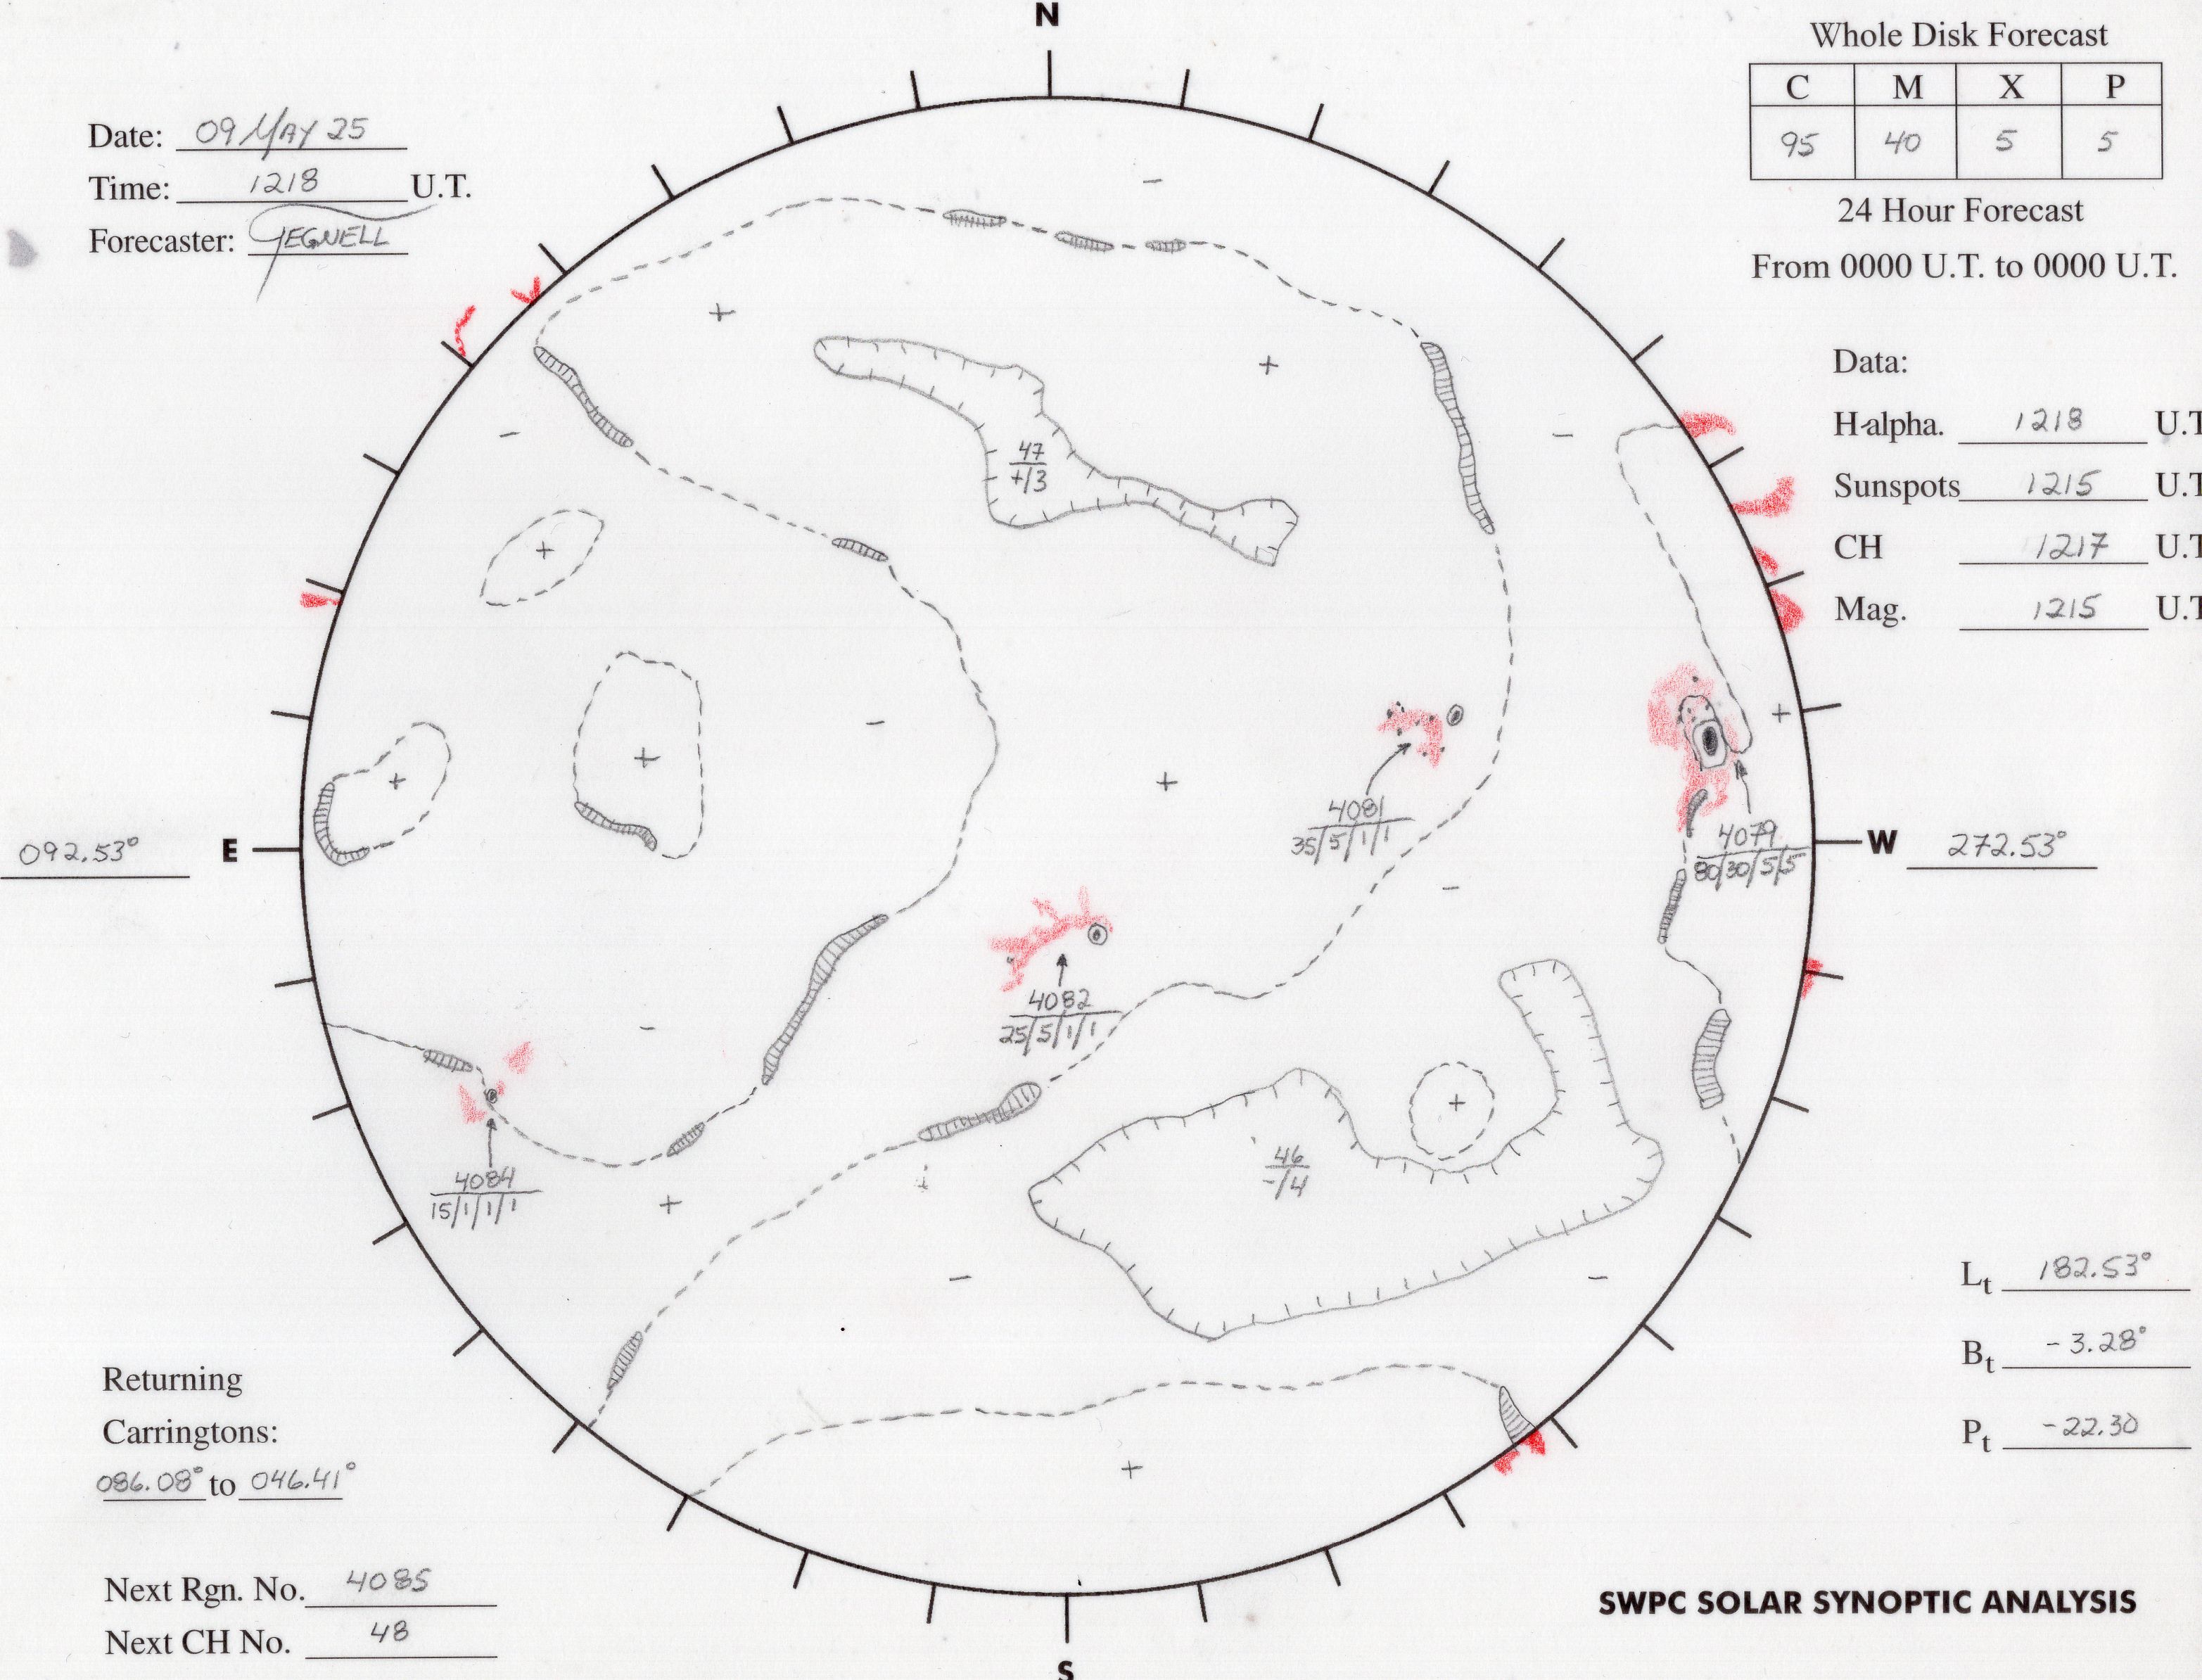
Synoptic Map:

Space Weather Overview:

Estimated Planetary K Index:

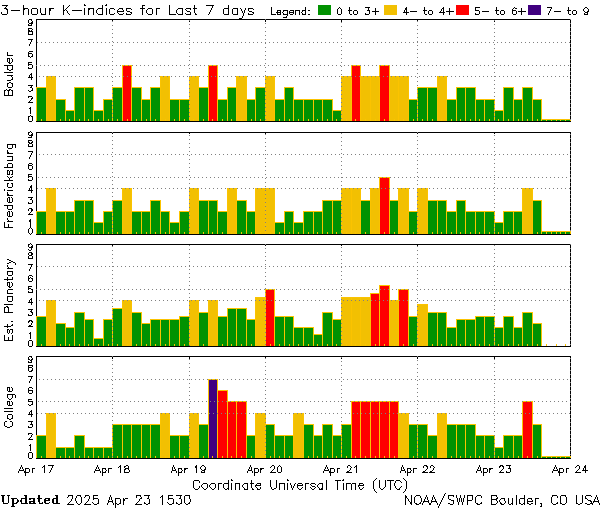
Daily K-Indices For The Past 7 Days:

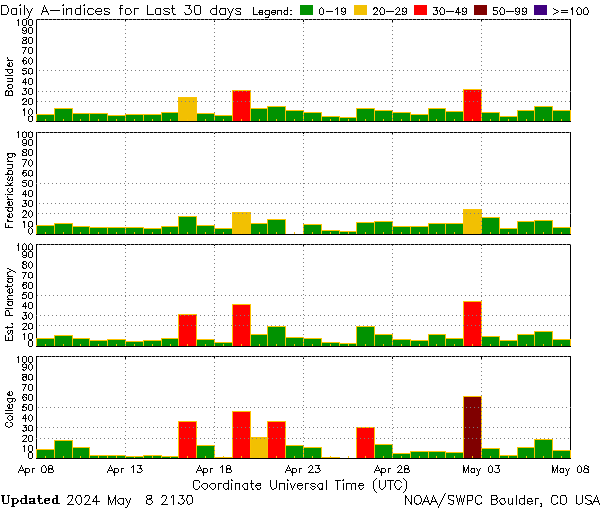
Daily A-Indices For The Past 30 Days:

Aurora Forecast - Northern Hemisphere:

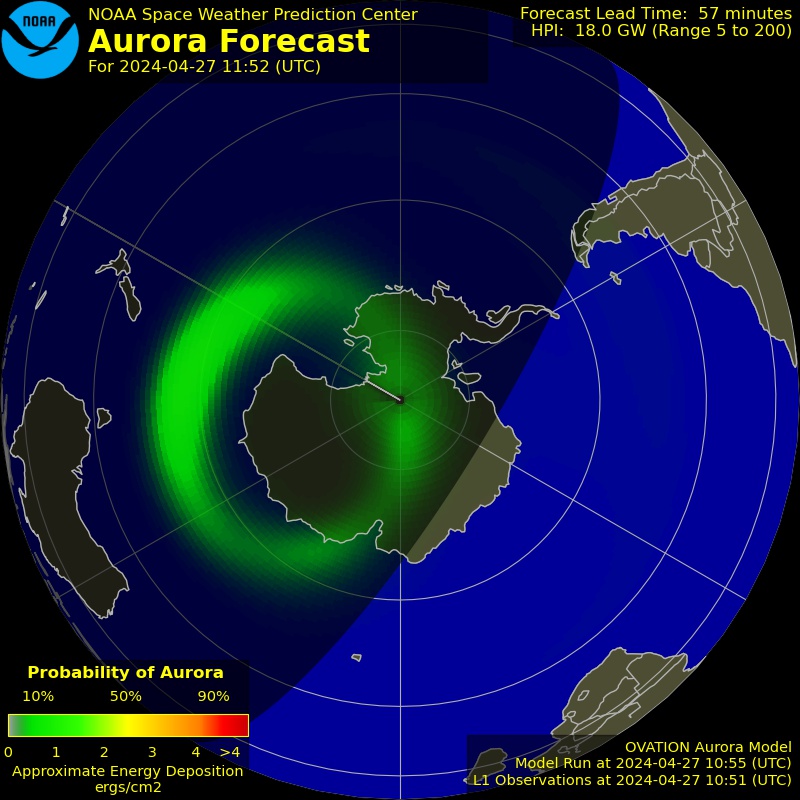
Aurora Forecast - Southern Hemisphere:

Geospace Timeline (7 Days):

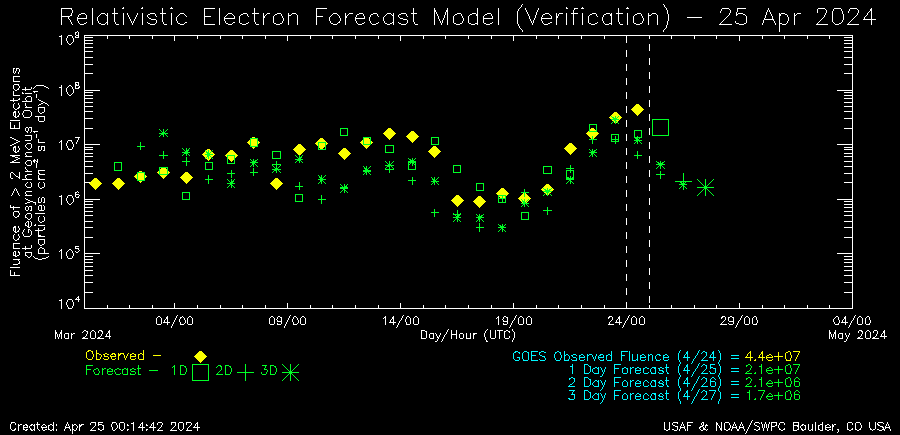
Relativistic Electron Forecast Model (Verification):

ACE RTSW (Estimated) EPAM

ACE RTSW (Estimated) MAG:

ACE RTSW Estimated MAG And SWEPAM:

ACE RTSW (Estimated) SWEPAM:

ACE RTSW (ESTIMATED) EPAM:

ACE RTSW (Estimated) SIS:

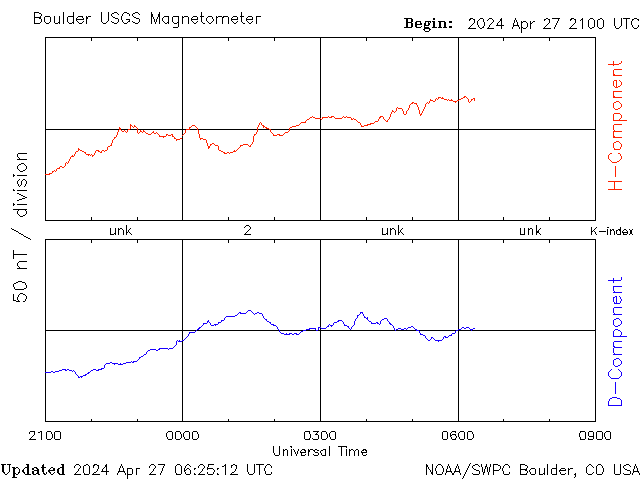
Boulder, Colorado Magnetometer:

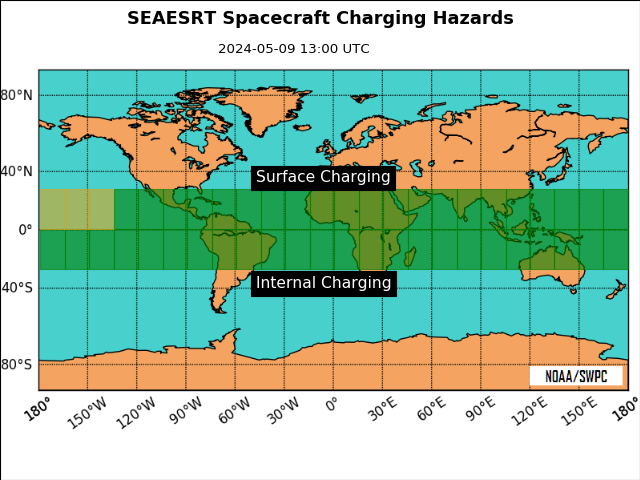
SEAESRT - Spacecraft Charging Hazards:

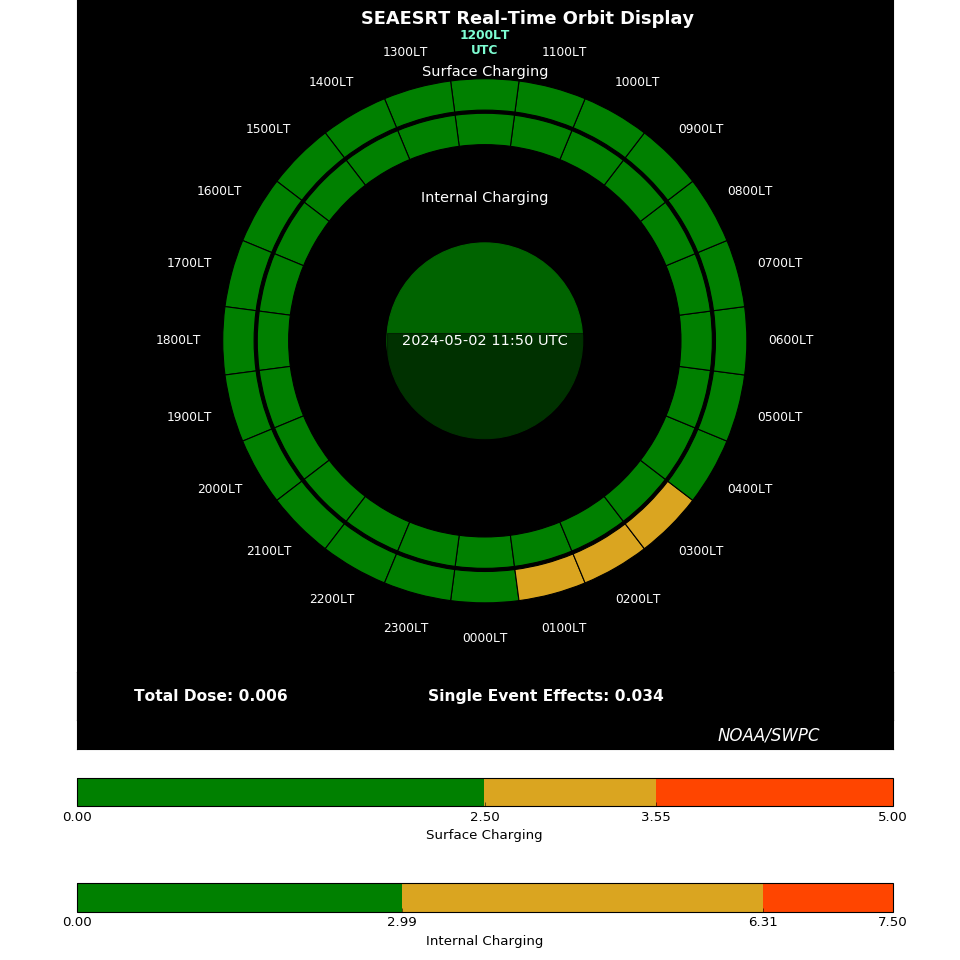
SEAESRT - Space Environment:

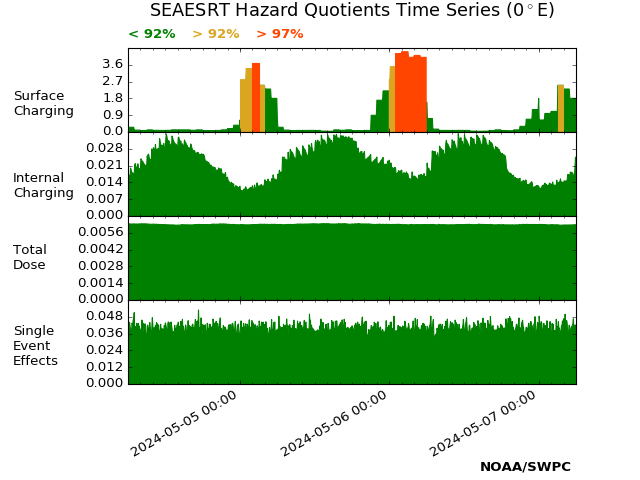
SEAESRT - Hazard Quotients Time Series (0° E):

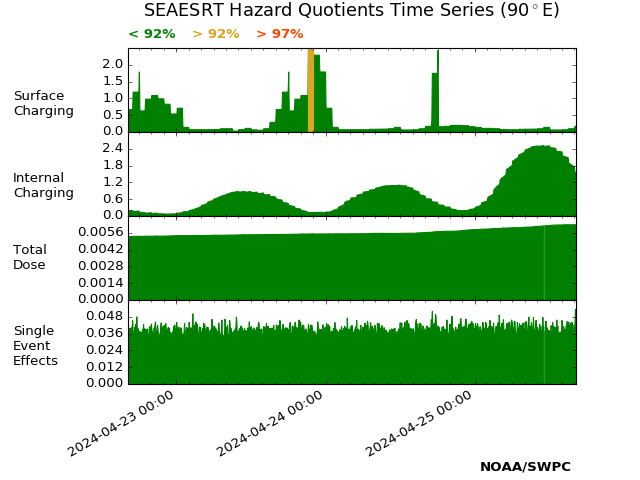
SEAESRT - Hazard Quotients Time Series (90° E):

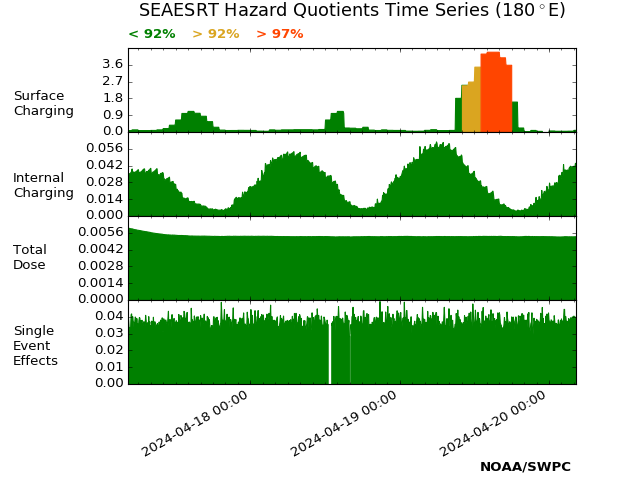
SEAESRT - Hazard Quotients Time Series (180° E):

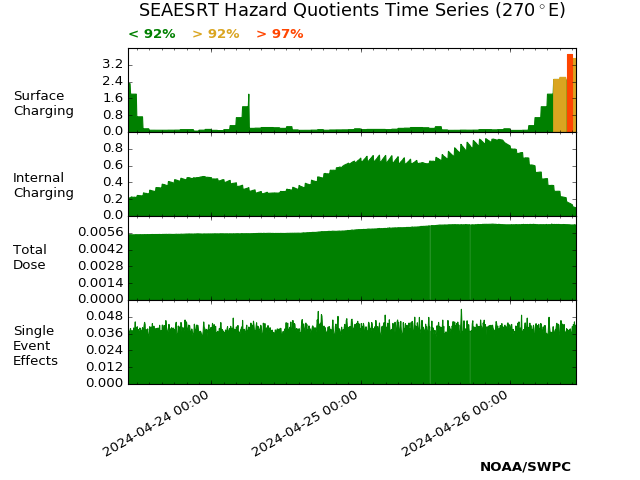
SEAESRT - Hazard Quotients Time Series (270° E):

ISES Solar Cycle F10.7 CM Radio Flux Progression:

ISES Solar Cycle Ap Progression:

ISES Solar Cycle Sunspot Number:

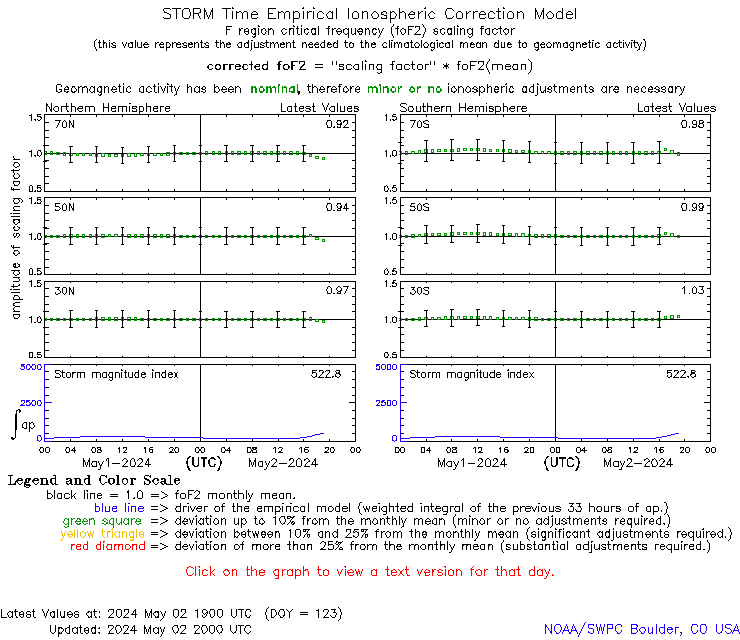
STORM Time Emperical Ionospheric Correction Model:

GOES-16 SUVI Composite 094 Angstroms:

GOES-16 SUVI Composite 131 Angstroms:

GOES-16 SUVI Composite 171 Angstroms:

GOES-16 SUVI Composite 195 Angstroms:

GOES-16 SUVI Composite 284 Angstroms:

GOES-16 SUVI Composite 304 Angstroms:

GOES-16 SUVI Thematic Map:

National Operational Hydrologic Remote Sensing Center
Latest Modeled Snow Depth: